5.4.7 Observability Stack
Observability Stack - Monitoring & Alerting
Overview
The Observability Stack is the Phase 7 monitoring layer of the EveryoneCook infrastructure. It provides comprehensive monitoring, alerting, and visualization for all deployed stacks through CloudWatch dashboards, alarms, and SNS notifications.
Deployment Order: This stack MUST be deployed LAST, after all other stacks (DNS, Certificate, Core, Auth, Backend, Frontend) are deployed.
⚠️ Environment Note: This guide focuses on Development (dev) environment deployment. For staging/production deployments, alarm thresholds and monitoring intervals may be different.
Key Responsibilities
- Create CloudWatch Dashboards for all stack layers
- Configure CloudWatch Alarms for critical metrics
- Setup SNS Topic for alarm notifications
- Create Composite Alarm for overall system health
- Monitor API Gateway, Lambda, DynamoDB, S3, CloudFront, and Cognito
- Track cost and billing metrics
What This Stack Includes
CloudWatch Dashboards (4 dashboards):
- Core Dashboard: DynamoDB, S3, CloudFront metrics
- Auth Dashboard: Cognito authentication metrics
- Backend Dashboard: API Gateway, Lambda, SQS metrics
- Overview Dashboard: Aggregated system health view
CloudWatch Alarms (15+ alarms):
- API Gateway: 5XX errors, 4XX errors, latency
- Lambda: Error rate, throttles, duration
- DynamoDB: Read/write throttles, latency
- S3: 4XX/5XX errors
- SQS: DLQ messages, queue age
- Cost: Daily spending warnings
Notification System:
- SNS Topic for alarm notifications
- Email subscriptions for alerts
- Composite alarm for system health
Architecture
┌──────────────────────────────────────────────────────────────────────┐
│            Observability Stack (Phase 7 - Dev Environment)            │
│                                                                       │
│  ┌─────────────────────────────────────────────────────────────────┐ │
│  │  SNS Topic (Alarm Notifications)                                │ │
│  │  ├─ Topic Name: EveryoneCook-dev-Alarms                        │ │
│  │  ├─ Email Subscription: team@everyonecook.cloud                │ │
│  │  └─ Protocol: Email (requires confirmation)                    │ │
│  └─────────────────────────────────────────────────────────────────┘ │
│                          │                                            │
│                          ▼ (Alarm Actions)                            │
│  ┌─────────────────────────────────────────────────────────────────┐ │
│  │  CloudWatch Alarms (15+ alarms)                                 │ │
│  │                                                                  │ │
│  │  API Gateway Alarms:                                            │ │
│  │  ├─ 5XX Error Rate > 5% (Critical)                             │ │
│  │  ├─ 4XX Error Rate > 20% (Warning)                             │ │
│  │  └─ P99 Latency > 3s (Warning)                                 │ │
│  │                                                                  │ │
│  │  Lambda Alarms:                                                 │ │
│  │  ├─ Error Rate > 5% (Critical)                                 │ │
│  │  ├─ Throttles > 10 (Critical)                                  │ │
│  │  └─ P99 Duration > 10s (Warning)                               │ │
│  │                                                                  │ │
│  │  DynamoDB Alarms:                                               │ │
│  │  ├─ Read Throttles > 10 (Critical)                             │ │
│  │  ├─ Write Throttles > 10 (Critical)                            │ │
│  │  └─ P99 Latency > 100ms (Warning)                              │ │
│  │                                                                  │ │
│  │  S3 Alarms:                                                     │ │
│  │  ├─ 4XX Error Rate > 5% (Warning)                              │ │
│  │  └─ 5XX Errors > 0 (Critical)                                  │ │
│  │                                                                  │ │
│  │  SQS Alarms:                                                    │ │
│  │  ├─ DLQ Messages > 0 (Critical)                                │ │
│  │  └─ Message Age > 5 minutes (Warning)                          │ │
│  │                                                                  │ │
│  │  Cost Alarms:                                                   │ │
│  │  ├─ Daily Cost > $50 (Warning)                                 │ │
│  │  └─ Daily Cost > $100 (Critical)                               │ │
│  └─────────────────────────────────────────────────────────────────┘ │
│                          │                                            │
│                          ▼                                            │
│  ┌─────────────────────────────────────────────────────────────────┐ │
│  │  Composite Alarm (System Health)                                │ │
│  │  ├─ Name: EveryoneCook-dev-SystemHealth                        │ │
│  │  ├─ Triggers: ANY critical alarm fires                         │ │
│  │  └─ Action: Send SNS notification                              │ │
│  └─────────────────────────────────────────────────────────────────┘ │
│                                                                       │
│  ┌─────────────────────────────────────────────────────────────────┐ │
│  │  CloudWatch Dashboards (4 dashboards)                           │ │
│  │                                                                  │ │
│  │  1. Core Dashboard (EveryoneCook-dev-Core):                    │ │
│  │     ├─ DynamoDB: Read/Write capacity, throttles, latency       │ │
│  │     ├─ S3: Requests, errors, bytes transferred                 │ │
│  │     └─ CloudFront: Requests, error rates, bytes downloaded     │ │
│  │                                                                  │ │
│  │  2. Auth Dashboard (EveryoneCook-dev-Auth):                    │ │
│  │     ├─ Cognito: Sign-ups, sign-ins                             │ │
│  │     └─ Cognito: Failed authentications                         │ │
│  │                                                                  │ │
│  │  3. Backend Dashboard (EveryoneCook-dev-Backend):              │ │
│  │     ├─ API Gateway: Requests, latency (P50/P95/P99)            │ │
│  │     ├─ API Gateway: 4XX/5XX errors                             │ │
│  │     ├─ Lambda: Invocations, duration, errors, throttles        │ │
│  │     └─ SQS: Messages sent, visible, oldest age                 │ │
│  │                                                                  │ │
│  │  4. Overview Dashboard (EveryoneCook-dev-Overview):            │ │
│  │     ├─ System Health: Environment info, region                 │ │
│  │     ├─ Key Metrics: API requests, latency, Lambda stats        │ │
│  │     ├─ Error Trends: API 5XX, Lambda errors (last hour)        │ │
│  │     ├─ Cost Tracking: Estimated daily cost, 7-day trend        │ │
│  │     └─ Alarm Status: Composite alarm widget                    │ │
│  └─────────────────────────────────────────────────────────────────┘ │
└──────────────────────────────────────────────────────────────────────┘
                          │
                          │ Monitors
                          ▼
        ┌──────────────────┴───────────────────┐
        ▼                  ▼                    ▼
   Core Stack        Auth Stack           Backend Stack
   (DynamoDB,        (Cognito)            (API Gateway,
    S3, CDN)                               Lambda, SQS)
Stack Configuration
File Structure
infrastructure/lib/stacks/
└── observability-stack.ts   # Observability Stack implementation (1175 lines)
Code Implementation Highlights
File: infrastructure/lib/stacks/observability-stack.ts
1. SNS Topic for Alarms
/**
 * Create SNS Topic for CloudWatch Alarms
 * Task 7.4.2 - Step 1
 */
private createAlarmTopic(): sns.Topic {
  const topic = new sns.Topic(this, 'AlarmTopic', {
    topicName: `EveryoneCook-${this.config.environment}-Alarms`,
    displayName: 'Everyone Cook CloudWatch Alarms',
  });

  // Add email subscription for alarm notifications
  topic.addSubscription(
    new sns_subscriptions.EmailSubscription(this.config.contact.email)
  );

  return topic;
}
Configuration: Email subscription requires confirmation via AWS SNS.
2. API Gateway Alarms
// API Gateway: High 5XX Error Rate (Critical)
const api5xxAlarm = new cloudwatch.Alarm(this, 'API-5XX-Critical', {
  alarmName: `EveryoneCook-${this.config.environment}-API-5XX-Critical`,
  alarmDescription: 'API Gateway 5XX error rate > 5% in 5 minutes',
  metric: new cloudwatch.Metric({
    namespace: 'AWS/ApiGateway',
    metricName: '5XXError',
    dimensionsMap: { ApiName: apiName },
    statistic: 'Sum',
    period: cdk.Duration.minutes(5),
  }),
  threshold: 5,
  evaluationPeriods: 2,
  comparisonOperator: cloudwatch.ComparisonOperator.GREATER_THAN_THRESHOLD,
  treatMissingData: cloudwatch.TreatMissingData.NOT_BREACHING,
});
api5xxAlarm.addAlarmAction(alarmAction);

// API Gateway: High Latency (Warning)
const apiLatencyAlarm = new cloudwatch.Alarm(this, 'API-Latency-High', {
  alarmName: `EveryoneCook-${this.config.environment}-API-Latency-High`,
  alarmDescription: 'API Gateway P99 latency > 3s in 5 minutes',
  metric: new cloudwatch.Metric({
    namespace: 'AWS/ApiGateway',
    metricName: 'Latency',
    dimensionsMap: { ApiName: apiName },
    statistic: 'p99',
    period: cdk.Duration.minutes(5),
  }),
  threshold: 3000, // 3 seconds in milliseconds
  evaluationPeriods: 2,
  comparisonOperator: cloudwatch.ComparisonOperator.GREATER_THAN_THRESHOLD,
});
3. Lambda Alarms
// Lambda: High Error Rate (Critical)
const lambdaErrorAlarm = new cloudwatch.Alarm(this, 'Lambda-Error-Rate', {
  alarmName: `EveryoneCook-${this.config.environment}-Lambda-Error-Rate`,
  alarmDescription: 'Lambda error rate > 5% in 5 minutes',
  metric: new cloudwatch.Metric({
    namespace: 'AWS/Lambda',
    metricName: 'Errors',
    statistic: 'Sum',
    period: cdk.Duration.minutes(5),
  }),
  threshold: 5,
  evaluationPeriods: 2,
  comparisonOperator: cloudwatch.ComparisonOperator.GREATER_THAN_THRESHOLD,
});

// Lambda: Throttles (Critical)
const lambdaThrottleAlarm = new cloudwatch.Alarm(this, 'Lambda-Throttle', {
  alarmName: `EveryoneCook-${this.config.environment}-Lambda-Throttle`,
  alarmDescription: 'Lambda throttles > 10 in 5 minutes',
  metric: new cloudwatch.Metric({
    namespace: 'AWS/Lambda',
    metricName: 'Throttles',
    statistic: 'Sum',
    period: cdk.Duration.minutes(5),
  }),
  threshold: 10,
  evaluationPeriods: 1,
});
4. DynamoDB Alarms
// DynamoDB: Read Throttles (Critical)
const dynamoReadThrottleAlarm = new cloudwatch.Alarm(this, 'DynamoDB-Read-Throttle', {
  alarmName: `EveryoneCook-${this.config.environment}-DynamoDB-Read-Throttle`,
  alarmDescription: 'DynamoDB read throttles > 10 in 5 minutes',
  metric: new cloudwatch.Metric({
    namespace: 'AWS/DynamoDB',
    metricName: 'ReadThrottleEvents',
    dimensionsMap: { TableName: dynamoTableName },
    statistic: 'Sum',
    period: cdk.Duration.minutes(5),
  }),
  threshold: 10,
  evaluationPeriods: 2,
});

// DynamoDB: High Latency (Warning)
const dynamoLatencyAlarm = new cloudwatch.Alarm(this, 'DynamoDB-Latency-High', {
  alarmName: `EveryoneCook-${this.config.environment}-DynamoDB-Latency-High`,
  alarmDescription: 'DynamoDB P99 latency > 100ms in 5 minutes',
  metric: new cloudwatch.Metric({
    namespace: 'AWS/DynamoDB',
    metricName: 'SuccessfulRequestLatency',
    dimensionsMap: {
      TableName: dynamoTableName,
      Operation: 'Query',
    },
    statistic: 'p99',
    period: cdk.Duration.minutes(5),
  }),
  threshold: 100, // 100ms
  evaluationPeriods: 3,
});
5. Composite Alarm
/**
 * Create Composite Alarm for overall system health
 * Task 7.4.2 - Step 2
 */
private createCompositeAlarm(alarms: cloudwatch.IAlarm[]): cloudwatch.CompositeAlarm {
  // Filter critical alarms only
  const criticalAlarms = alarms.filter(
    (alarm) => alarm.alarmName.includes('Critical') || alarm.alarmName.includes('Throttle')
  );

  const compositeAlarm = new cloudwatch.CompositeAlarm(this, 'SystemHealth', {
    compositeAlarmName: `EveryoneCook-${this.config.environment}-SystemHealth`,
    alarmDescription: 'Overall system health - triggers if any critical alarm fires',
    alarmRule: cloudwatch.AlarmRule.anyOf(
      ...criticalAlarms.map((alarm) =>
        cloudwatch.AlarmRule.fromAlarm(alarm, cloudwatch.AlarmState.ALARM)
      )
    ),
  });

  compositeAlarm.addAlarmAction(new cloudwatch_actions.SnsAction(this.alarmTopic));
  return compositeAlarm;
}
6. Core Dashboard
/**
 * Create Core Dashboard (DynamoDB, S3, CloudFront)
 */
private createCoreDashboard(props: ObservabilityStackProps): cloudwatch.Dashboard {
  const dashboard = new cloudwatch.Dashboard(this, 'CoreDashboard', {
    dashboardName: `EveryoneCook-${this.config.environment}-Core`,
  });

  // DynamoDB Metrics
  dashboard.addWidgets(
    new cloudwatch.GraphWidget({
      title: 'DynamoDB - Read/Write Capacity',
      left: [
        new cloudwatch.Metric({
          namespace: 'AWS/DynamoDB',
          metricName: 'ConsumedReadCapacityUnits',
          dimensionsMap: { TableName: dynamoTableName },
          statistic: 'Sum',
          period: cdk.Duration.minutes(5),
        }),
        new cloudwatch.Metric({
          namespace: 'AWS/DynamoDB',
          metricName: 'ConsumedWriteCapacityUnits',
          dimensionsMap: { TableName: dynamoTableName },
          statistic: 'Sum',
          period: cdk.Duration.minutes(5),
        }),
      ],
      width: 12,
    }),
    new cloudwatch.GraphWidget({
      title: 'DynamoDB - Throttles',
      left: [
        new cloudwatch.Metric({
          namespace: 'AWS/DynamoDB',
          metricName: 'ReadThrottleEvents',
          dimensionsMap: { TableName: dynamoTableName },
          statistic: 'Sum',
          period: cdk.Duration.minutes(5),
        }),
        new cloudwatch.Metric({
          namespace: 'AWS/DynamoDB',
          metricName: 'WriteThrottleEvents',
          dimensionsMap: { TableName: dynamoTableName },
          statistic: 'Sum',
          period: cdk.Duration.minutes(5),
        }),
      ],
      width: 12,
    })
  );

  // S3 and CloudFront metrics...
  return dashboard;
}
7. Overview Dashboard
/**
 * Create Overview Dashboard (Aggregated view)
 */
private createOverviewDashboard(props: ObservabilityStackProps): cloudwatch.Dashboard {
  const dashboard = new cloudwatch.Dashboard(this, 'OverviewDashboard', {
    dashboardName: `EveryoneCook-${this.config.environment}-Overview`,
  });

  // System Health Header
  dashboard.addWidgets(
    new cloudwatch.TextWidget({
      markdown: `# Everyone Cook - System Overview\n\n**Environment:** ${this.config.environment}\n\n**Region:** ${this.region}`,
      width: 24,
      height: 2,
    })
  );

  // Key Metrics: API, Lambda, DynamoDB, S3
  // Cost Tracking
  // Alarm Status Widget

  return dashboard;
}
Deployment Guide
Prerequisites
Before deploying the Observability Stack, ensure:
All other stacks deployed:
- DNS Stack (Phase 1)
- Certificate Stack (Phase 1.5)
- Core Stack (Phase 2)
- Auth Stack (Phase 3)
- Backend Stack (Phase 4)
- Frontend Stack (Phase 6 - Amplify)
Stack exports available:
aws cloudformation list-exports --region ap-southeast-1Expected exports:
EveryoneCook-dev-Core-TableNameEveryoneCook-dev-Core-ContentBucketNameEveryoneCook-dev-Core-DistributionIdEveryoneCook-dev-Auth-UserPoolIdEveryoneCook-dev-Backend-ApiName
Email configured:
- Valid email in
infrastructure/config/dev.ts - Email will receive SNS subscription confirmation
- Valid email in
Step 1: Review Configuration
File: infrastructure/config/dev.ts
export const devConfig: EnvironmentConfig = {
  environment: 'dev',
  region: 'ap-southeast-1',

  // Email for alarm notifications
  contact: {
    email: 'your-email@example.com',  // ⚠️ Update this
    phone: '+1234567890',
  },

  // Monitoring settings (already configured)
  monitoring: {
    enableDetailedMonitoring: true,
    retainLogs: true,
    logRetentionDays: 7,
    enableXRay: false,  // Disabled for dev to save costs
  },
};
⚠️ Important: Update the email address to receive alarm notifications.
Step 2: Synthesize CloudFormation Template
Navigate to infrastructure directory:
cd D:\Project_AWS\everyonecook\infrastructure
Synthesize the Observability Stack:
npm run synth
Expected Output (1175 lines):
✨ Synthesis time: 3.5s

Resources:
[+] AWS::SNS::Topic                         AlarmTopic
[+] AWS::SNS::Subscription                  AlarmTopic/EmailSubscription
[+] AWS::CloudWatch::Alarm                  API-5XX-Critical
[+] AWS::CloudWatch::Alarm                  API-4XX-Warning
[+] AWS::CloudWatch::Alarm                  API-Latency-High
[+] AWS::CloudWatch::Alarm                  Lambda-Error-Rate
[+] AWS::CloudWatch::Alarm                  Lambda-Throttle
[+] AWS::CloudWatch::Alarm                  Lambda-Duration-High
[+] AWS::CloudWatch::Alarm                  DynamoDB-Read-Throttle
[+] AWS::CloudWatch::Alarm                  DynamoDB-Write-Throttle
[+] AWS::CloudWatch::Alarm                  DynamoDB-Latency-High
[+] AWS::CloudWatch::Alarm                  S3-4XX-Warning
[+] AWS::CloudWatch::Alarm                  S3-5XX-Critical
[+] AWS::CloudWatch::Alarm                  SQS-DLQ-Messages
[+] AWS::CloudWatch::Alarm                  SQS-Queue-Age
[+] AWS::CloudWatch::Alarm                  Cost-Warning
[+] AWS::CloudWatch::Alarm                  Cost-Critical
[+] AWS::CloudWatch::CompositeAlarm         SystemHealth
[+] AWS::CloudWatch::Dashboard              CoreDashboard
[+] AWS::CloudWatch::Dashboard              AuthDashboard
[+] AWS::CloudWatch::Dashboard              BackendDashboard
[+] AWS::CloudWatch::Dashboard              OverviewDashboard

Outputs:
- AlarmTopicArn
- CompositeAlarmName
- CoreDashboardName
- AuthDashboardName
- BackendDashboardName
- OverviewDashboardName
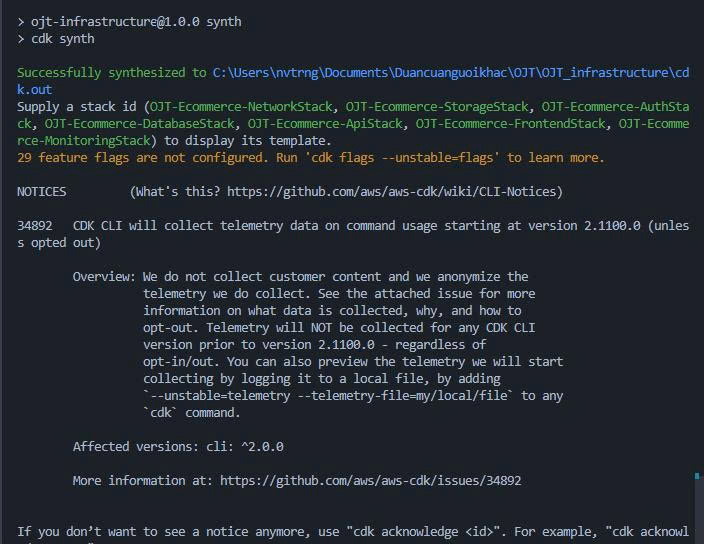 Screenshot: CDK synth output showing all Observability Stack resources
Step 3: Review Generated Template
Open the generated CloudFormation template:
code infrastructure/cdk.out/EveryoneCook-dev-Observability.template.json
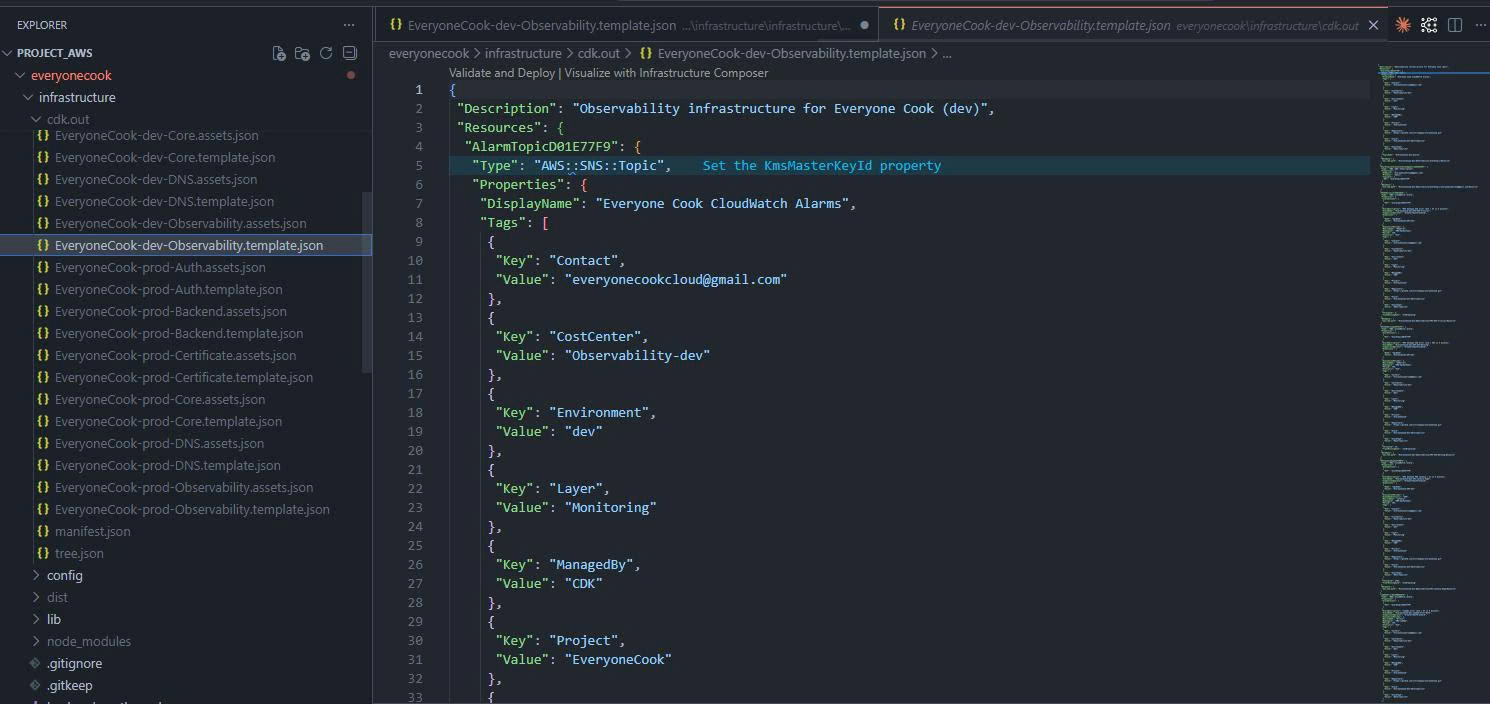 Screenshot: Generated CloudFormation template showing SNS Topic, 15+ Alarms, Composite Alarm, and 4 Dashboards
Step 4: Deploy Observability Stack
Deploy using CDK:
npx cdk deploy EveryoneCook-dev-Observability --require-approval never
Expected Deployment Time: 2-3 minutes
Deployment Output:
EveryoneCook-dev-Observability: deploying...

EveryoneCook-dev-Observability: creating CloudFormation changeset...

EveryoneCook-dev-Observability

Outputs:
EveryoneCook-dev-Observability.AlarmTopicArn = arn:aws:sns:ap-southeast-1:123456789012:EveryoneCook-dev-Alarms
EveryoneCook-dev-Observability.CompositeAlarmName = EveryoneCook-dev-SystemHealth
EveryoneCook-dev-Observability.CoreDashboardName = EveryoneCook-dev-Core
EveryoneCook-dev-Observability.AuthDashboardName = EveryoneCook-dev-Auth
EveryoneCook-dev-Observability.BackendDashboardName = EveryoneCook-dev-Backend
EveryoneCook-dev-Observability.OverviewDashboardName = EveryoneCook-dev-Overview

Stack ARN:
arn:aws:cloudformation:ap-southeast-1:123456789012:stack/EveryoneCook-dev-Observability/...

✨ Deployment time: 2m 15s
Verification
Step 1: Verify CloudFormation Stack
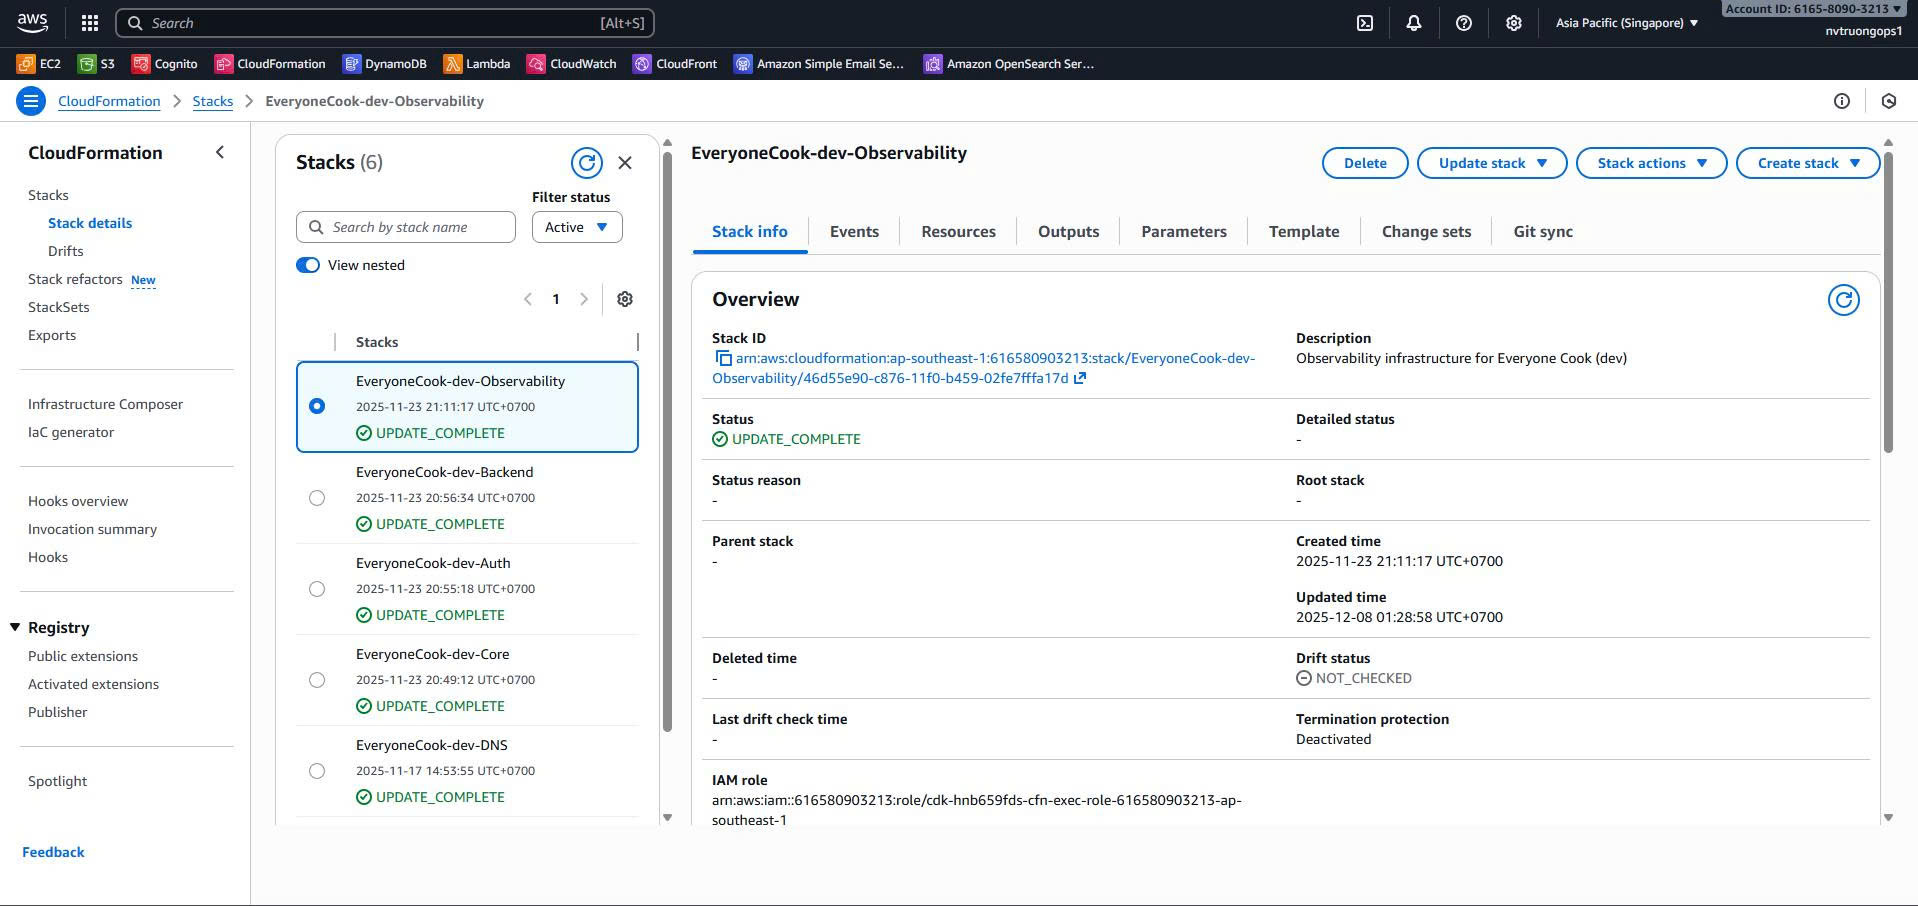
Navigate to CloudFormation Console:
AWS Console → CloudFormation → Stacks
Verify Stack:
- Stack Name:
EveryoneCook-dev-Observability - Status: CREATE_COMPLETE ✅
- Resources: 24 resources created
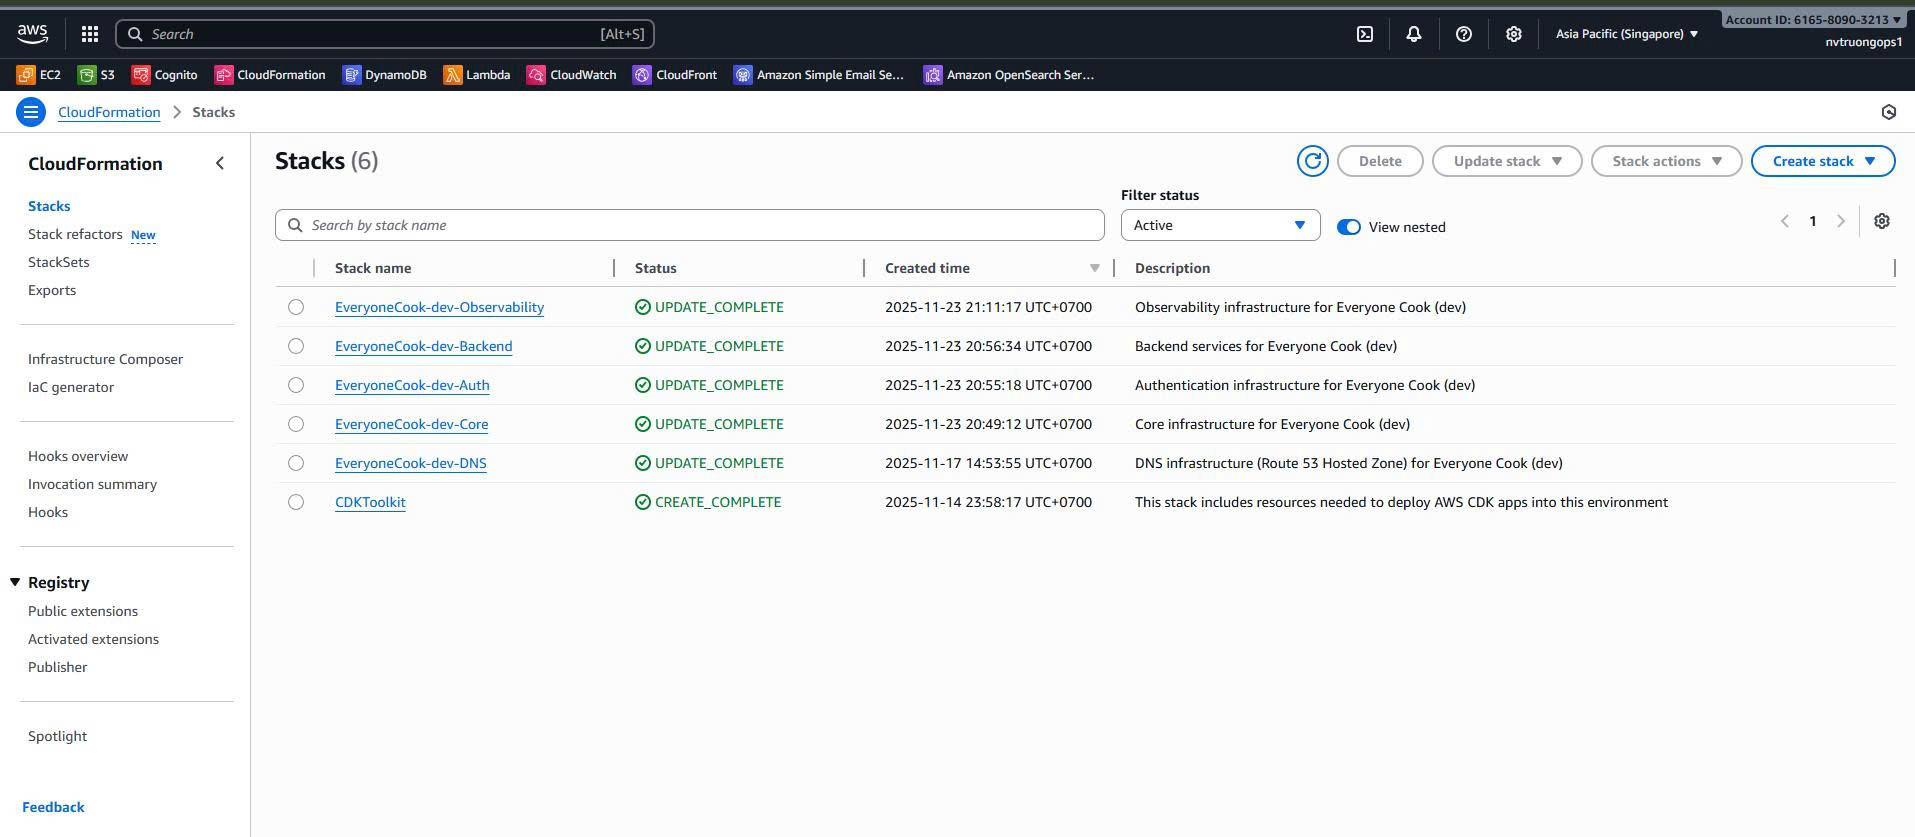 Screenshot: CloudFormation stack with CREATE_COMPLETE status and 24 resources
 Screenshot: CloudFormation Outputs tab showing all 6 outputs
Step 2: Verify CloudWatch Alarms
Navigate to CloudWatch Console → Alarms:
AWS Console → CloudWatch → All alarms
Verify Alarms Created (15+ alarms):
| Alarm Name | Type | Metric | Threshold | Status |
|---|---|---|---|---|
EveryoneCook-dev-API-5XX-Critical | Critical | API 5XX Errors | > 5 | OK |
EveryoneCook-dev-API-4XX-Warning | Warning | API 4XX Errors | > 20 | OK |
EveryoneCook-dev-API-Latency-High | Warning | API P99 Latency | > 3000ms | OK |
EveryoneCook-dev-Lambda-Error-Rate | Critical | Lambda Errors | > 5 | OK |
EveryoneCook-dev-Lambda-Throttle | Critical | Lambda Throttles | > 10 | OK |
EveryoneCook-dev-Lambda-Duration-High | Warning | Lambda P99 Duration | > 10000ms | OK |
EveryoneCook-dev-DynamoDB-Read-Throttle | Critical | DynamoDB Read Throttles | > 10 | OK |
EveryoneCook-dev-DynamoDB-Write-Throttle | Critical | DynamoDB Write Throttles | > 10 | OK |
EveryoneCook-dev-DynamoDB-Latency-High | Warning | DynamoDB P99 Latency | > 100ms | OK |
EveryoneCook-dev-S3-4XX-Warning | Warning | S3 4XX Errors | > 5% | OK |
EveryoneCook-dev-S3-5XX-Critical | Critical | S3 5XX Errors | > 0 | OK |
EveryoneCook-dev-SQS-DLQ-Messages | Critical | SQS DLQ Messages | > 0 | OK |
EveryoneCook-dev-SQS-Queue-Age | Warning | SQS Message Age | > 300s | OK |
EveryoneCook-dev-Cost-Warning | Warning | Daily Cost | > $50 | OK |
EveryoneCook-dev-Cost-Critical | Critical | Daily Cost | > $100 | OK |
Verify Composite Alarm:
- Name:
EveryoneCook-dev-SystemHealth - Type: Composite
- Rule: ANY critical alarm → ALARM
- Status: OK ✅
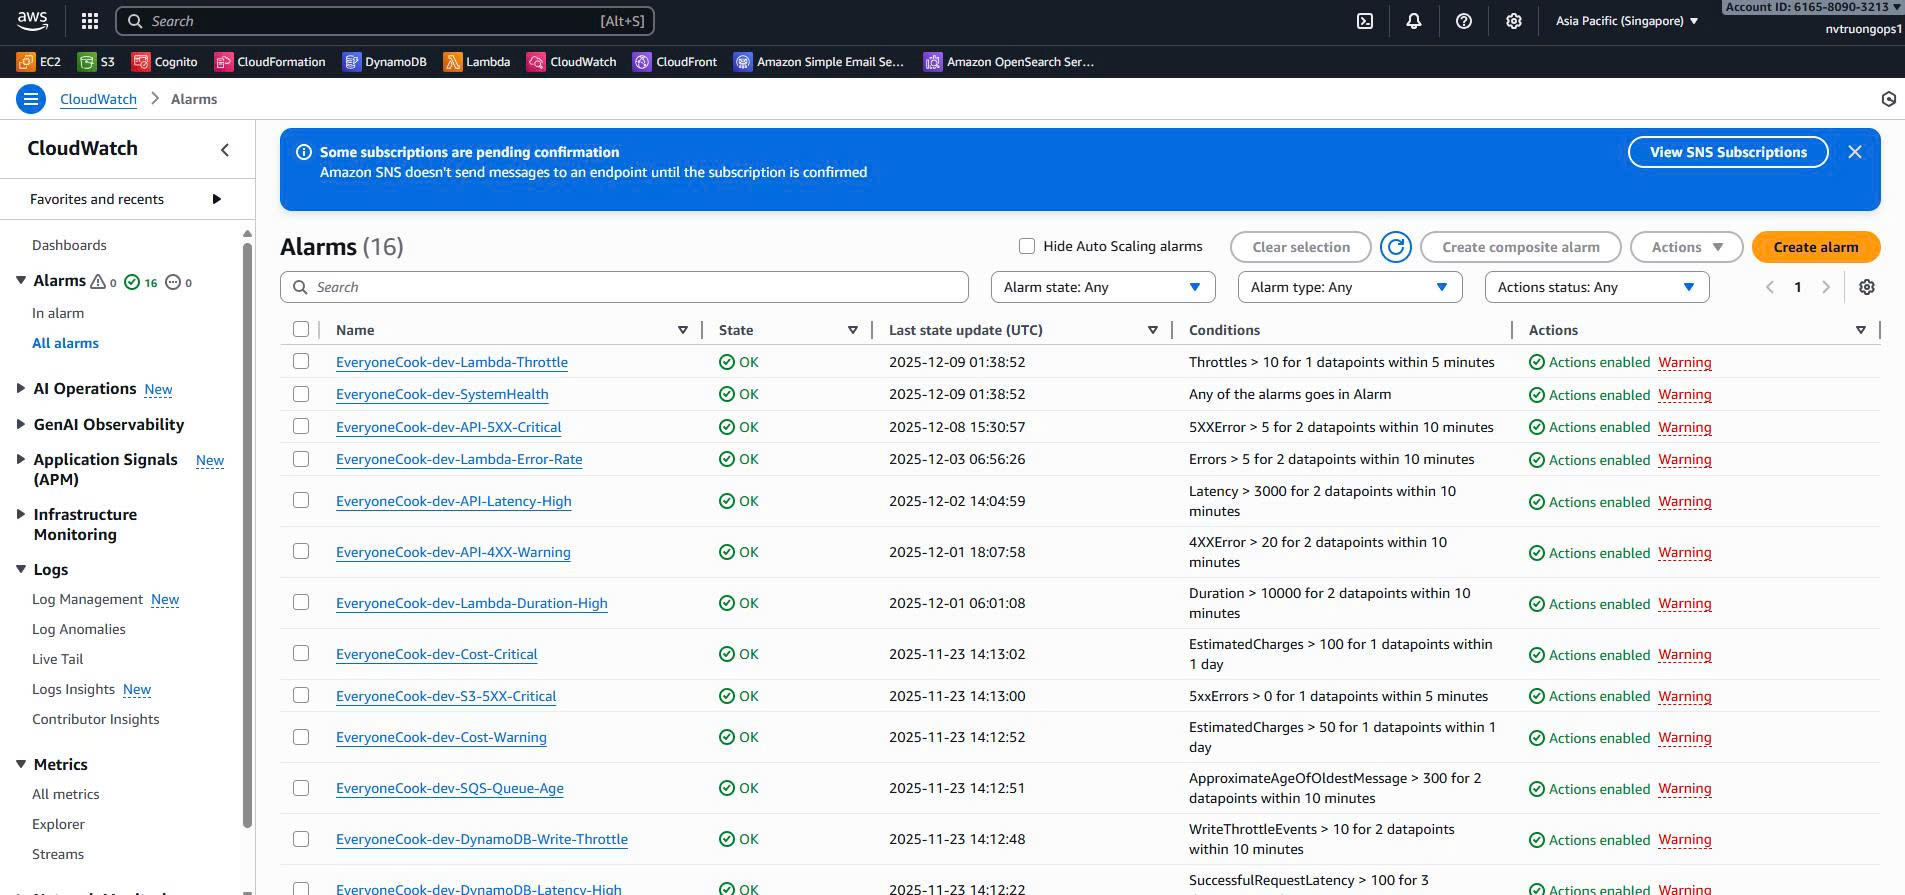 Screenshot: CloudWatch Alarms console showing all 15+ alarms with OK status
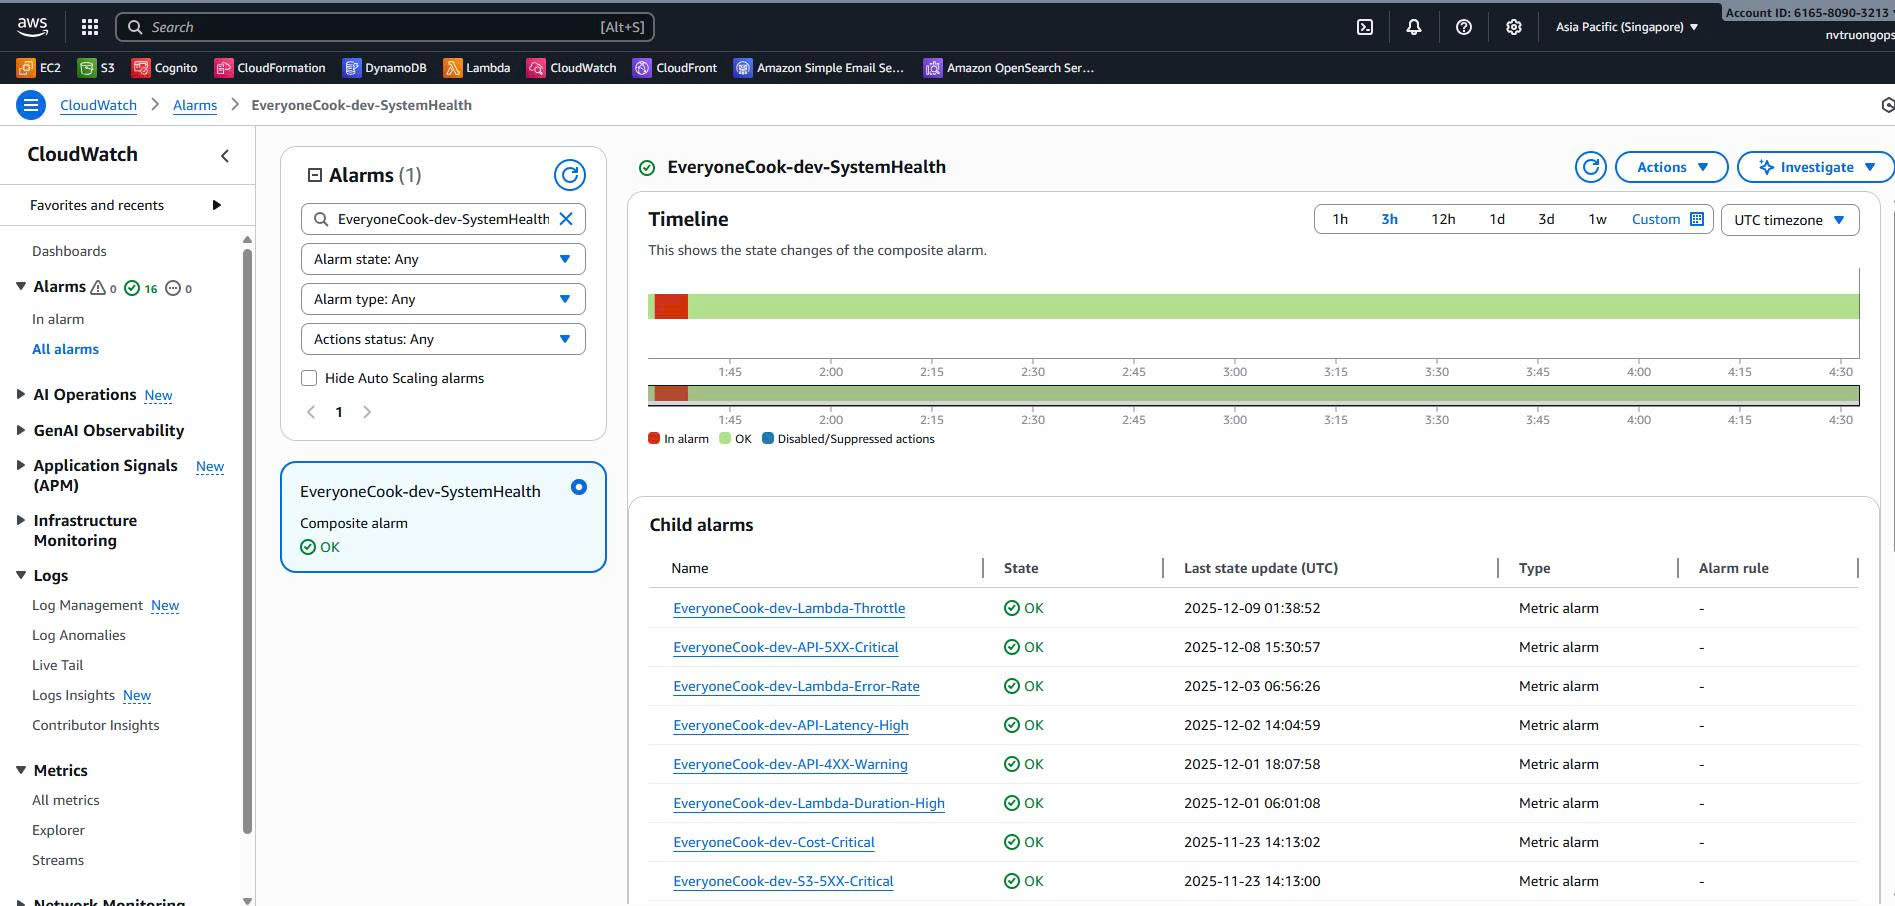 Screenshot: Composite alarm details for system health monitoring
Step 3: Verify CloudWatch Dashboards
Navigate to CloudWatch Console → Dashboards:
AWS Console → CloudWatch → Dashboards
Verify Dashboards Created (5 dashboards):
1. Core Dashboard (EveryoneCook-dev-Core)
Open the dashboard and verify widgets:
DynamoDB Widgets:
- Read/Write Capacity graph
- Throttles graph
- Latency (P99) graph
- Table Size metric
S3 Widgets:
- Requests graph
- Errors (4XX/5XX) graph
CloudFront Widgets:
- Requests graph
- Error Rate (4XX/5XX) graph
- Bytes Downloaded graph
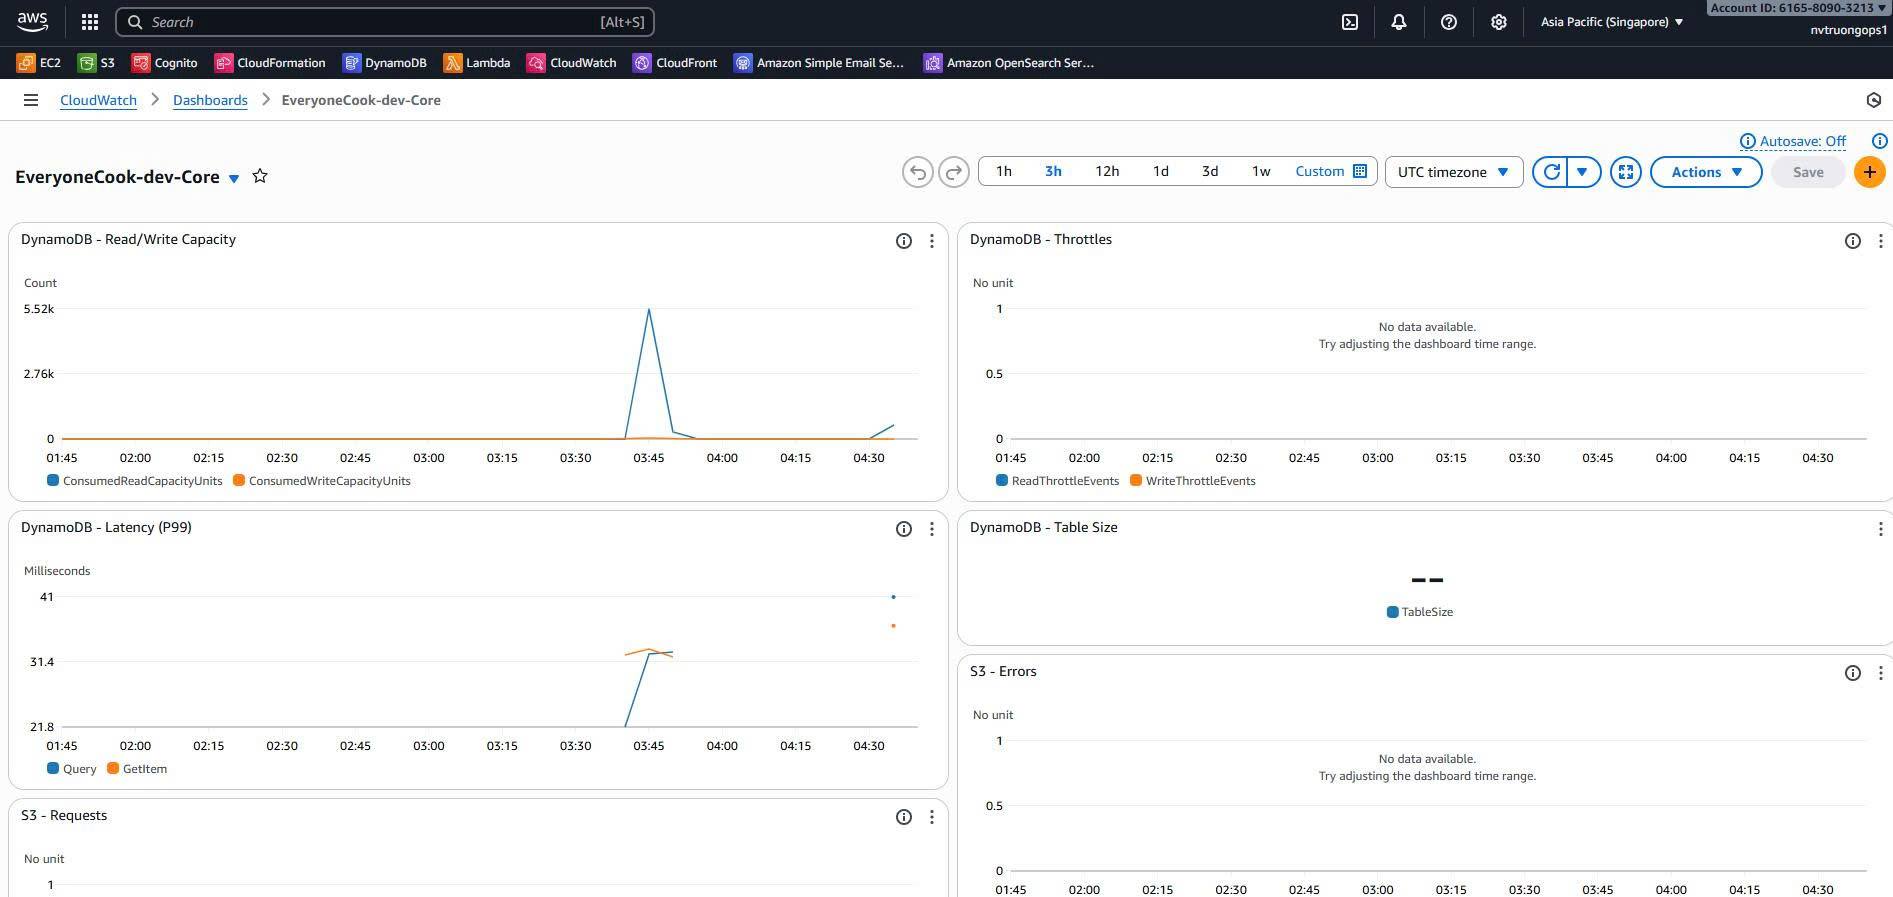 Screenshot: Core Dashboard showing DynamoDB, S3, and CloudFront metrics
2. Auth Dashboard (EveryoneCook-dev-Auth)
Cognito Widgets:
- Sign-ups graph
- Sign-ins graph
- Failed Authentications graph
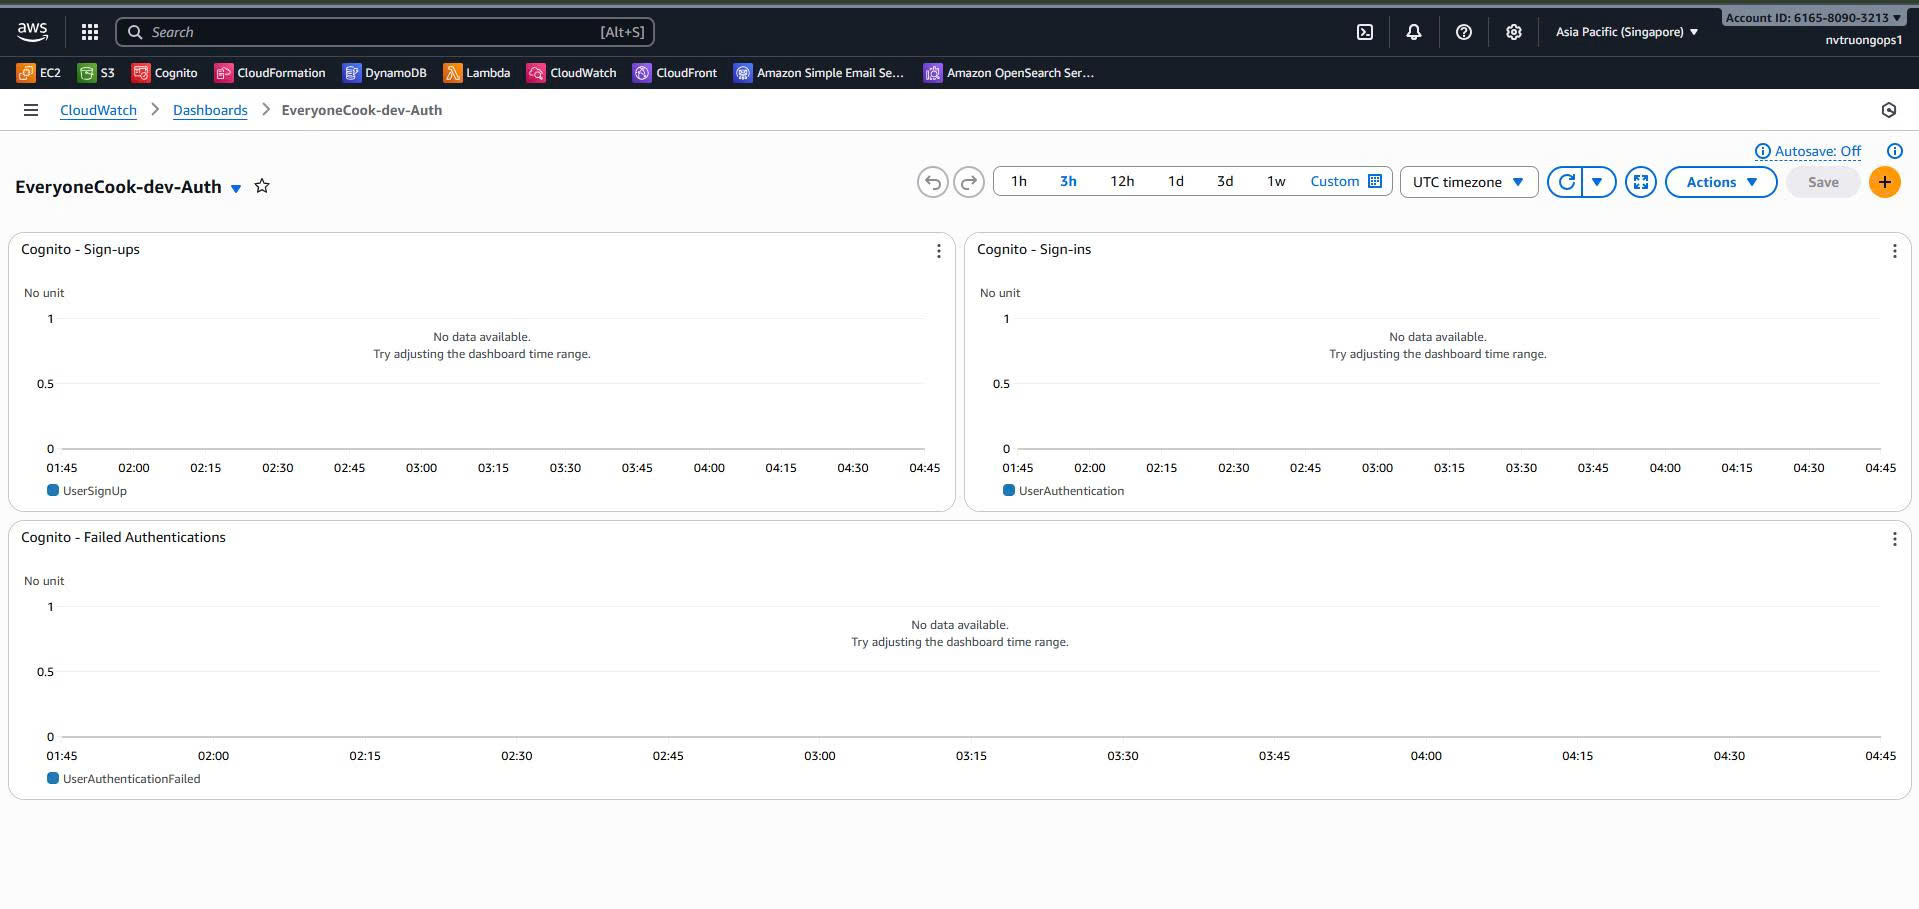 Screenshot: Auth Dashboard showing Cognito authentication metrics
3. Backend Dashboard (EveryoneCook-dev-Backend)
API Gateway Widgets:
- Requests graph
- Latency (P50/P95/P99) graph
- 4XX Errors graph
- 5XX Errors graph
Lambda Widgets:
- Invocations graph
- Duration (P99) graph
- Errors graph
- Throttles graph
SQS Widgets:
- Messages Sent graph
- Messages Visible graph
- Oldest Message Age graph
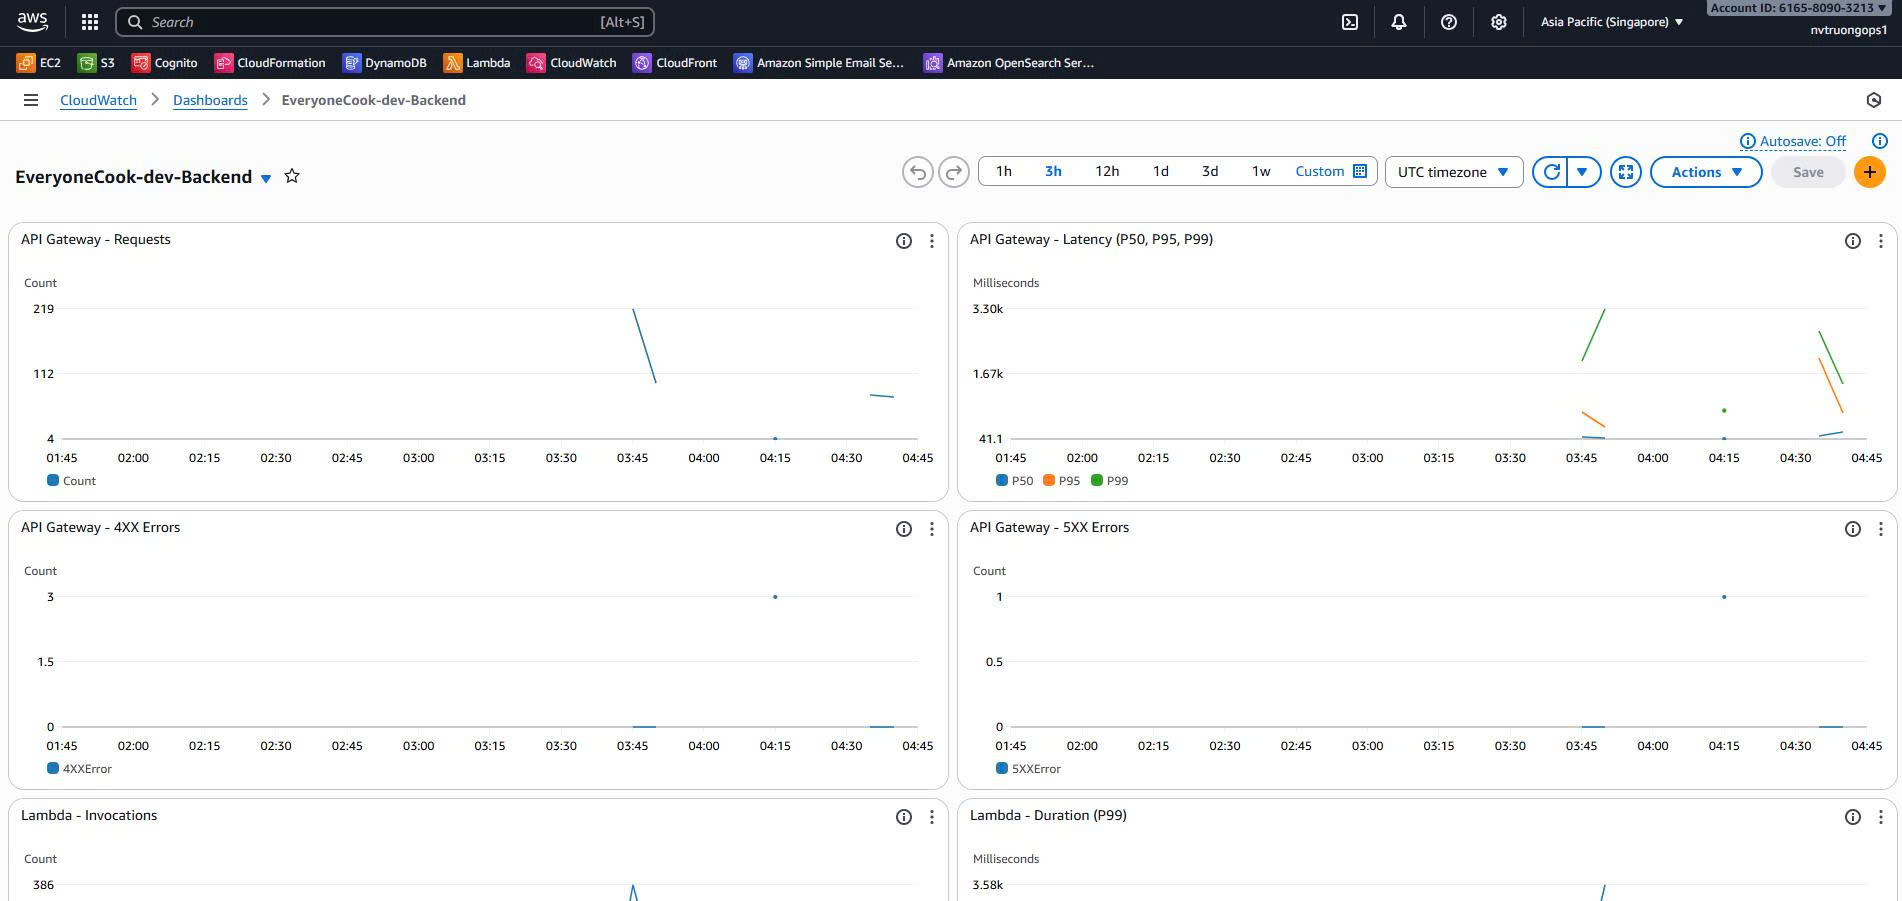 Screenshot: Backend Dashboard showing API Gateway, Lambda, and SQS metrics
4. Overview Dashboard (EveryoneCook-dev-Overview)
System Health Section:
- Header with environment info
- Region information
Key Metrics:
- API Requests (5m) - Single value widget
- API P99 Latency - Single value widget
- Lambda Invocations (5m) - Single value widget
- Lambda Errors (5m) - Single value widget
- DynamoDB Read/Write Throttles - Single value widgets
- S3 Requests and Errors - Single value widgets
Trends:
- Error Rates graph (API 5XX, Lambda Errors)
Cost Tracking:
- Estimated Daily Cost - Single value widget
- Cost Trend (7 days) - Graph widget
Alarm Status:
- Composite Alarm widget showing system health
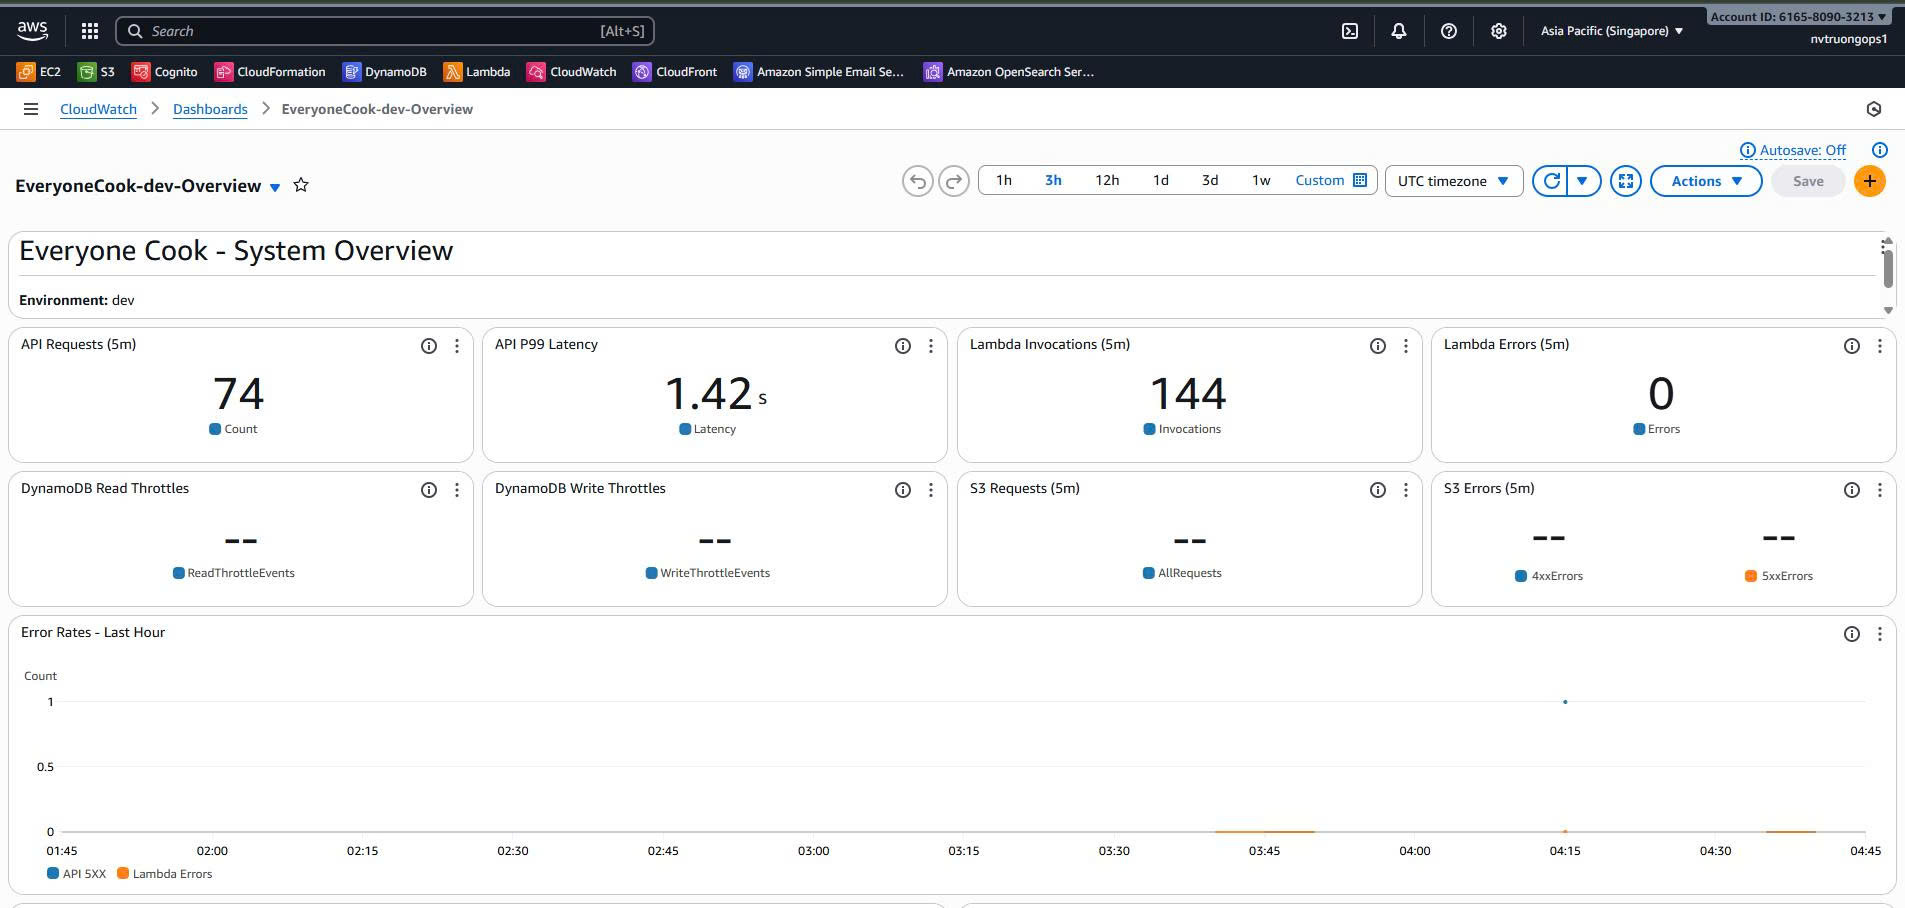 Screenshot: Overview Dashboard with system health, key metrics, error trends, and cost tracking
Cost Breakdown
Monthly Costs (Development)
| Service | Resource | Quantity | Unit Cost | Total |
|---|---|---|---|---|
| CloudWatch Alarms | Standard alarms | 15 | $0.10/alarm | $1.50 |
| CloudWatch Alarms | Composite alarm | 1 | $0.50/alarm | $0.50 |
| CloudWatch Dashboards | Dashboards (>3) | 1 | $3.00/dashboard | $3.00 |
| CloudWatch Metrics | Standard resolution | Included | Free | $0.00 |
| SNS | Email notifications | <1000 | Free tier | $0.00 |
| CloudWatch Logs | 7-day retention | ~5 GB | $0.50/GB | $2.50 |
| Total | $7.50/month |
Free Tier Benefits:
- First 3 dashboards: Free
- First 10 alarms: Free (covered)
- First 1M API requests to CloudWatch: Free
- SNS email (first 1000): Free
Next Steps
After deploying the Observability Stack:
Confirm Email Subscription: Check inbox and confirm SNS subscription
Review Dashboards: Familiarize yourself with all 4 dashboards
Test Alarms: Trigger a test alarm to verify notifications
Monitor Costs: Check daily cost tracking in Overview Dashboard
⏭️ Deploy Frontend: Continue to 5.10 Deploy to Amplify
⏭️ Test End-to-End: Test complete application flow and monitor metrics
📊 Review Metrics: After 24 hours, review all dashboards for baseline metrics
Summary
You have successfully deployed the Observability Stack with:
1 SNS Topic for alarm notifications
15+ CloudWatch Alarms for critical metrics
1 Composite Alarm for overall system health
4 CloudWatch Dashboards for monitoring
Email Notifications configured and confirmed
Key Achievements:
- Complete visibility into system health
- Proactive alerting for critical issues
- Cost tracking and optimization
- Centralized monitoring dashboards
Total Resources: 24 CloudFormation resources
Deployment Time: ~2-3 minutes
Monthly Cost: ~$7.50 (dev environment)
🎉 Congratulations! You have completed all infrastructure stack deployments. Your EveryoneCook platform now has comprehensive monitoring and observability.
Next: 5.10 Deploy to Amplify to deploy the Next.js frontend application.